BI Tools Comparison: AI Capabilities and Features Comparison
Business intelligence (BI) tools have come a long way—from static reports and spreadsheets to dynamic dashboards and now AI-driven analytics. These tools help organizations transform raw data into insights for decision-making.
Over the past decade, leading BI platforms like Tableau, Microsoft Power BI, and Looker have become essential for data visualization and self-service analytics. Now, the emergence of generative AI is reshaping this landscape. New entrants such as Wisdom AI are pushing BI beyond traditional boundaries, enabling users to simply “chat” with their data and get contextual, intelligent answers.
In this article, we explore how BI tools have evolved, discuss essential features for these tools, and compare how Tableau, Power BI, Looker, and Wisdom AI stack up in the GenAI era.
BI tools comparison: A summary of key features
The table below outlines the desirable capabilities of a modern BI tool.
Evolution of BI tools
Early BI solutions relied on IT-built static dashboards and predefined reports. They offered valuable historical snapshots but were inflexible for ad hoc questions: Any new inquiry required technical experts and lengthy report cycles.
The next generation, self-service BI, empowered business users with interactive dashboards and drag-and-drop interfaces. This shift reduced dependence on data teams.
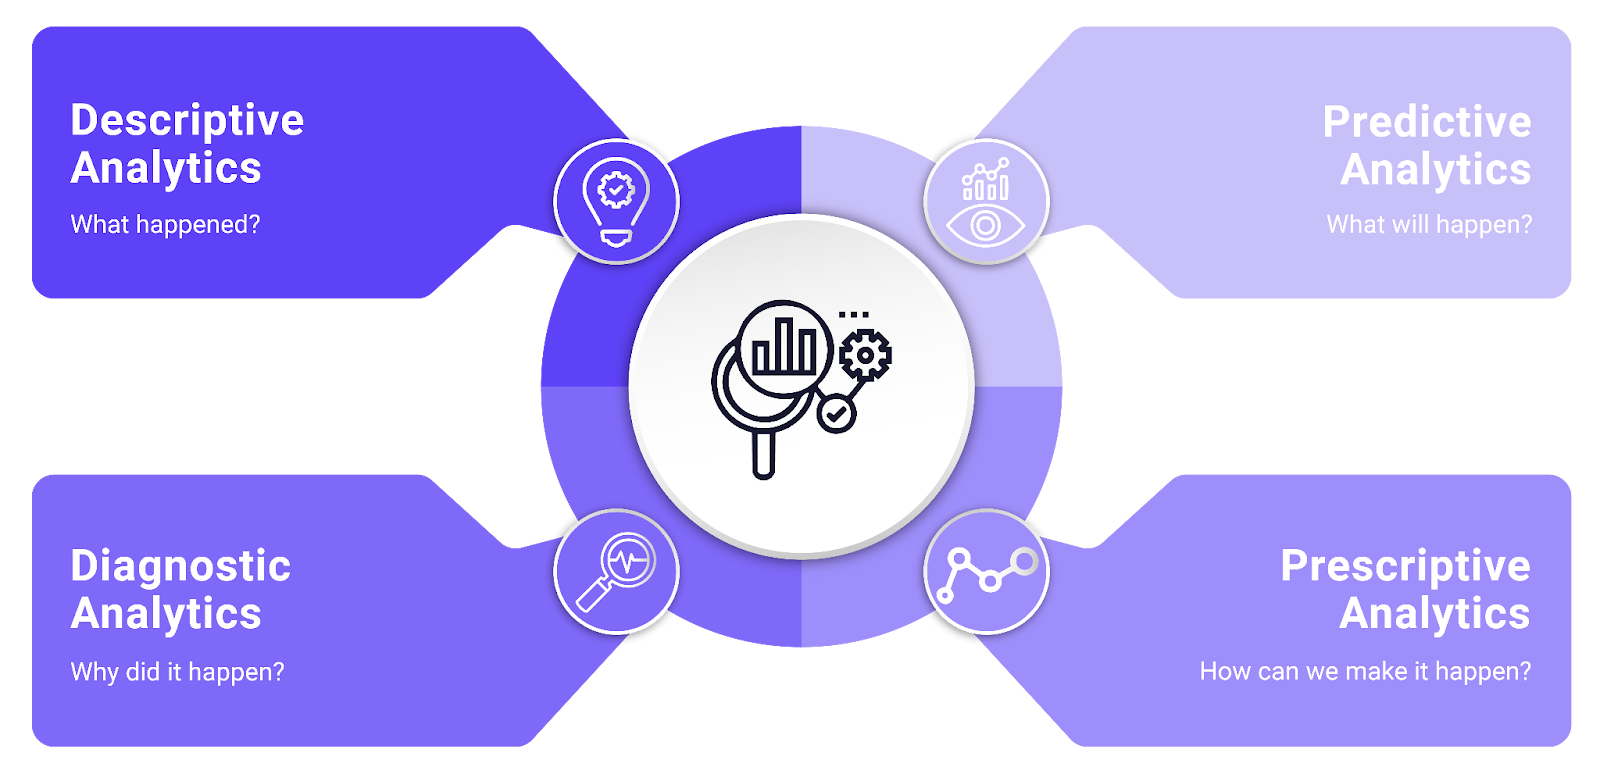
In recent years, augmented analytics has introduced machine learning and automation into the mix. Gartner defines augmented analytics as using AI/ML to assist data preparation, insight generation, and explanation. This era saw organizations start to automate insight discovery and recommend analyses, easing the analytical workload on humans.
Rise of natural language querying
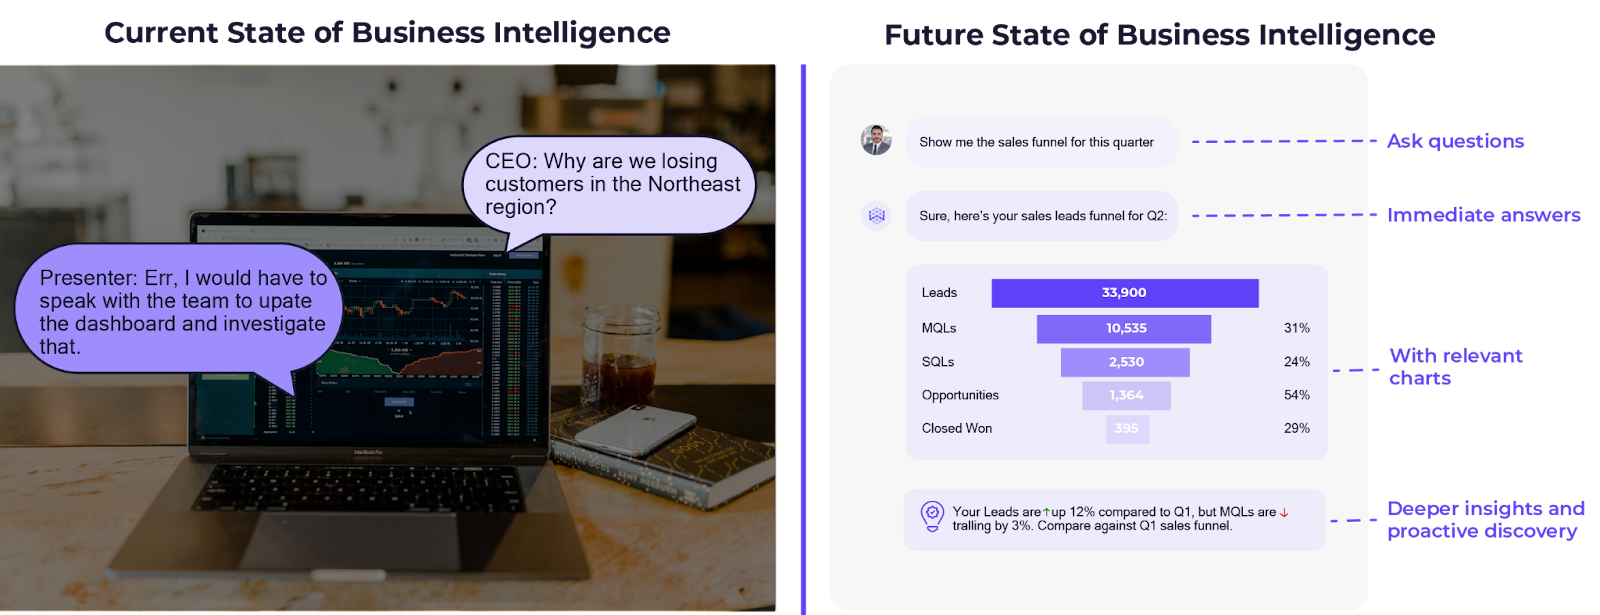
Perhaps the most transformative change has been the introduction of natural language interfaces in BI. Instead of clicking through charts, users can now ask questions in plain English and get answers from their data. This capability makes BI tools more accessible to nontechnical audiences, bridging the gap between data experts and business users.
Modern advanced BI platforms feature conversational interfaces that interpret a user’s intent and even support follow-up questions, making data exploration as simple as having a conversation. The impact is significant—natural language querying lowers the barrier to entry, enabling more stakeholders to derive insights without needing SQL or specialized BI skills. In essence, BI tools are evolving from passive reporting instruments into active, AI-powered assistants that can understand context and generate insights proactively.
Challenges with traditional BI tools in the GenAI era
Most legacy BI tools were not built for the fluid, intelligent analysis demanded by the GenAI paradigm. Traditional BI systems depend on predefined data schemas, static models, and manual setup, which makes them inflexible when business needs change rapidly. They often require users to navigate complex dashboards or write SQL queries for anything beyond the prebuilt views, creating a steep learning curve for non-experts. Even as vendors have added piecemeal AI features to legacy platforms, the core architecture has remained the same, meaning that the tools struggle to adapt to new questions or data sources without significant human intervention.
A common limitation is the “static dashboard problem,” where users can only drill down into preset charts but cannot easily ask novel questions outside the predefined scope. Imagine a sales manager who wants to compare last quarter’s revenue across different regions and identify which products performed best in each area. The manager’s existing dashboard might only show total revenue per region—without a breakdown by product—forcing the user to either request a new report from IT (which could take weeks) or export data to spreadsheets. Such a manual workaround would disrupt the analytical flow while also creating siloed “one-off” analyses that risk inconsistent figures across different teams. And by the time the sales manager received the updated insights, they might be too outdated to drive timely decisions.
In addition, legacy BI tools typically lack cross-domain analysis capabilities. Dashboards are often siloed by function or dataset, while real business questions cut across multiple data domains (sales, marketing, product, etc.). Without AI assistance, the burden is on the user to manually integrate these perspectives.
Traditional BI wasn’t designed with generative AI or large language models in mind, so features like conversational querying or AI-driven analytics are “bolted on,” if they are available at all. As a result, older platforms can feel “out of sync” with GenAI expectations—they offer lots of charts but little insight generation.
{{banner-large-3="/banners"}}
How to choose the right BI platform
In the era of GenAI, selecting a BI tool requires evaluating a new set of capabilities beyond just basic reporting and visualization. Here are some key features and criteria to consider when choosing a modern BI platform.
Rapid data connectivity and processing
The tool should connect to all of your relevant data sources quickly and handle large volumes in or near real time. Fast, flexible data connectivity ensures that you can analyze up-to-date information without lengthy ETL processes.
Modern AI-driven BI platforms minimize the heavy upfront data modeling. They can dynamically tap into disparate databases, cloud data warehouses, or even unstructured sources as needed. This means insights can be drawn on demand, rather than waiting for a centralized data lake to be perfectly curated. Choose a platform that automates data prep tasks and can scale as your data grows, so performance won’t lag when you throw bigger datasets or new sources at it.
Conversational interfaces
In a GenAI-enabled tool, a conversational or natural language interface is a must-have for broad user adoption. This feature allows users to ask questions in everyday language—like “show me the sales trend by region this quarter”—and receive answers with relevant charts or explanations. A good conversational BI interface understands context—an example being a follow-up question like “what about for enterprise customers only?”—making the experience interactive and intuitive. Such interfaces greatly lower the learning curve, empowering business users who might not be skilled in data analysis to self-serve insights.
When evaluating platforms, look for robust natural language querying capabilities and how well the system handles complex or ambiguous queries. The best solutions use AI to interpret intent and even guide users with clarifying questions.
Automated insights and visualization capabilities
Leading BI tools now include AI features that can automatically generate analyses or visuals, which is a game changer for productivity. This could mean automatically building the optimal chart based on your question, suggesting the best way to visualize a particular dataset, or even running diagnostic analyses in the background.
For instance, suppose you ask “why did customer churn spike last month?” An AI-enhanced BI tool might automatically examine dozens of factors and produce an optimal chart or written summary of the likely causes. Such automated insight generation accelerates the discovery of patterns that a human analyst might miss or take days to uncover.
When comparing tools, check for features like “auto insights,” “explain why” analyses, or recommendations for next steps. A strong platform will turn raw data into digestible visuals and narratives without requiring the user to manually build every query or chart.
Support for GenAI and advanced analytics
Finally, ensure that the BI platform is future-proof with respect to AI and advanced analytics. This includes native support for machine learning models, predictive analytics, and integration with generative AI. Many incumbents (like Power BI, Tableau, and Looker) have started to embed AI features like predictive forecasting, anomaly detection, or natural language generation. However, a truly GenAI-ready BI tool goes further: It's built with GenAI as the foundation, offering features like semantic layers that allow for your organizational knowledge to be globally defined and derive context from across your business units, preventing data siloes.
If your organization plans to leverage AI now or in the future, evaluate how well each tool can incorporate AI outputs; for example, does it allow fine-tuning an internal model on your data? Advanced analytics support also means robust statistical functions, what-if analysis, and the ability to handle unstructured data or conversational outputs. Choosing a BI platform that embraces AI will ensure that your investment stays relevant as AI-driven analytics become the norm in business.
Comparison of BI tools and features
Recommendations
Choosing the right BI tool comes down to your organization’s specific needs, but there are universal considerations to keep in mind:
- Align with your use cases: Define the primary goals for BI in your organization (e.g., real-time dashboarding, deep exploratory analysis, or ad-hoc querying by business users). Make sure the tool excels at those priorities. For example, if business users need to do their own analysis, a platform with an easy interface and NLQ is vital.
- Run a pilot with real data: Even a well-reviewed tool can behave differently once it’s connected to your data sources. Conducting a pilot or proof-of-concept with a representative data set allows you to assess how the BI tool handles your data structures, complexity, and user workflows. This step reveals any unforeseen compatibility or performance issues and helps build user confidence before full-scale adoption.
- Ease of setup and integration: Consider how easily the tool can be deployed and connected to your existing data stack. A cloud-based BI solution can simplify setup and maintenance. Verify that it supports all your data sources (databases, cloud warehouses, spreadsheets, PDFs, etc.) out-of-the-box, so you won’t face roadblocks during implementation.
- Security and compliance: Many industries, such as finance and healthcare, must follow strict data handling regulations (e.g., GDPR, HIPAA, PCI). Ensure that the BI platform offers robust encryption, role-based access control, single sign-on (SSO), and other relevant security measures. If your company’s data environment is highly regulated, confirm that the tool can maintain compliance in areas like audit trails and user activity logging.
- User adoption and learning curve: The best BI tool is one that your team will actually use. Evaluate the UI and complexity; a manageable learning curve and intuitive experience will drive higher adoption. Tools that offer guided analytics or conversational help can empower even non-analysts. Also plan adequate training and onboarding to help users become comfortable with the new system.
- Change management: Implementing a new BI platform is not just a technical upgrade but a change in workflow. Secure executive sponsorship and communicate the benefits to end-users early. It helps to start with a pilot or a specific team, gather feedback, and champion quick wins (e.g., an insight discovered through the new tool) to build momentum. Ensure that you have support for the migration of existing reports and that you’re ready to address the cultural shift (some people may be used to Excel or old tools).
- Future-proofing and scalability: Think long term. Will this platform scale as your data volume grows or as more users come on board? Check pricing models for scaling. Additionally, consider the vendor’s innovation roadmap: Are they investing in new AI features and updates? A tool that’s actively evolving will help your BI investment stay relevant as technology advances.
{{banner-small-3="/banners"}}
Last thoughts
Business intelligence is entering a new era shaped by generative AI. Organizations that once relied on static quarterly reports can now get instant, AI-augmented answers to pressing questions. In this landscape, it’s important to future-proof BI investments. Choosing a platform that embraces advancements like natural language querying, automation, and machine learning will pay off in resilience. The BI tools of tomorrow will not just visualize data but interpret it, offering proactive guidance in decision-making.
As you compare Tableau, Power BI, Looker, Wisdom AI, or any other solution, keep an eye on how well each adapts to the paradigm shift. The goal is to empower your organization with insights at speed and scale, delivered in a user-friendly way. Generative AI is poised to become an integral part of analytics workflows, so adopting a BI platform that can leverage AI effectively is a strategic move. The best BI tool for the GenAI era is one that combines robust data capabilities with the intelligence and ease-of-use that modern businesses demand, ensuring that your analytics strategy remains competitive and future-ready.